Nathan.LuforMicroFIRE's team blogganhua.wang·May 7, 2024OTel Errors當不同的語言對於錯誤(Error)或異常(Exception)的定義以及處理方式存在差異時,例如 Go 就沒有exception,而是用panic。Go 鼓勵開發者將普通的error視為正常的情況,然後返回普通的錯誤值在處理這些情況,而不是全部的問題都視為無法處理的異常。而其他語言如 Java 則支持拋出和捕獲異常。 因此需要在這些語言中標準化錯誤或異常的定義。OpenTelemetry是解決這個問題的工具之一,它提供了以下功能: 錯誤在後端的可視化: 後端中錯誤的呈現方式可能與您預期的不同,...DiscussOpenTelemetry
Metismetis.hashnode.dev·May 7, 2024Why You Should Leverage Database Integration with OpenTelemetryDatabase observability is crucial for maintaining optimal performance and reliability in modern software systems. It enables organizations to monitor key metrics such as query execution time, resource utilization, and transaction throughput, facilita...DiscussSQL
Milan Jovanovićmilanjovanovic.hashnode.dev·Apr 20, 2024Introduction to Distributed Tracing With OpenTelemetry in .NETIf you're building or maintaining distributed .NET applications, understanding how they behave is key to ensuring reliability and performance. Distributed systems offer flexibility but introduce complexity, making troubleshooting a headache. Understa...Discuss·94 readsOpenTelemetry
Jonathan Wrightblog.techytechster.com·Apr 19, 2024Metrics And Tracing on AWS Lambda in GolangIntroduction When writing an application, you want to make sure there are metrics and tracing, both of these are extremely fundamental in any debugging process once it is in production. AWS Lambda is a great problem space to utilize a language such a...Discuss·38 readscloudwatch-emf
Raul NaupariProblog.raulnq.com·Apr 17, 2024Scaling Amazon Elastic Kubernetes Service Workloads with KEDA, OTEL Collector, and Amazon CloudWatchIn our article, Scaling Amazon Elastic Kubernetes Service Workloads with KEDA and Amazon CloudWatch, we suggested using the OTEL Collector to send application metrics to CloudWatch. Today, we will show how to do this in two different ways: Deploying...DiscussOpenTelemetry
Cloud Tunedcloudtuned.hashnode.dev·Apr 12, 2024Exploring OpenTelemetry: A Unified Observability FrameworkExploring OpenTelemetry: A Unified Observability Framework OpenTelemetry is an open-source observability framework designed to provide standardized instrumentation, collection, and export of telemetry data for distributed systems and microservices ar...Discussobservability
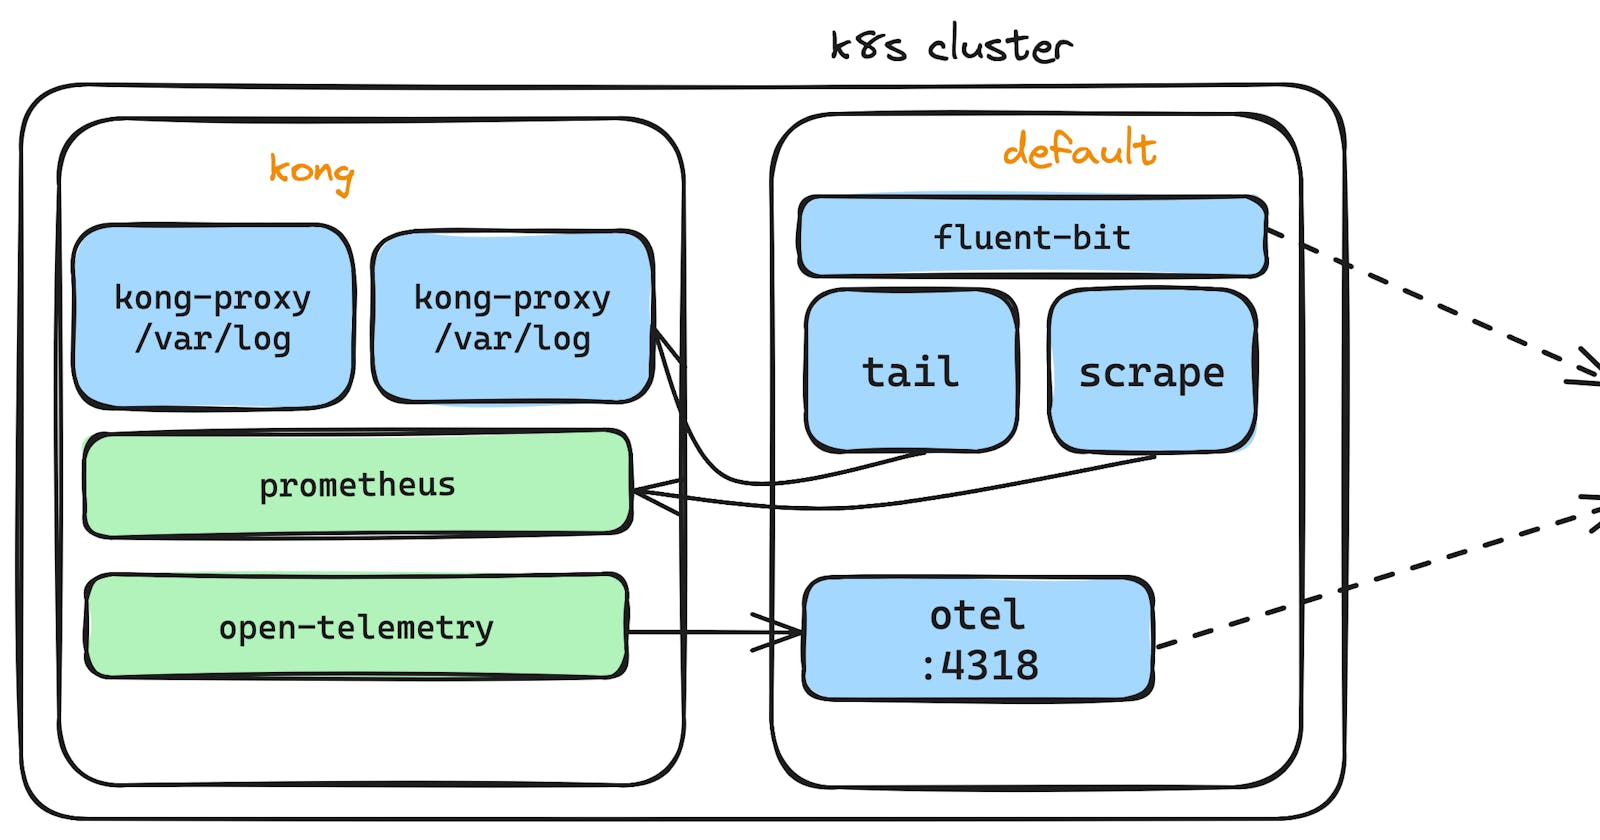
John Williamsblog.jwconsult.in·Apr 7, 2024How to instrument observability in KongThis blog talks about how you can integrate the observability features from Kong onto any platform of choice supported by fluent-bit for logs and metrics and otel for traces. It's also published as a webinar in CNCF, if you would like to rather hear ...Discuss·47 readskong
Chamoda Ranasingheblog.chamodaranasinghe.com·Apr 2, 2024Using Opentelemetry instrumentation and tracing to mitigate performance bottlenecks.In the dynamic landscape of web development, optimizing the performance of applications is not just a goal but a necessity. When it comes to NestJS Apollo GraphQL applications, incorporating Opentelemetry instrumentation and tracing can significantly...DiscussOpenTelemetry
Hope Oluwalolopeblog.hopeoluwalolope.com·Mar 8, 2024Adopting Observability Practices In Your Technical TeamIn the ever-evolving landscape of software development, one truth remains constant: outages and issues are inevitable. However, the frustration that comes from debugging code—especially when it's not your own—can often feel like an insurmountable cha...Discuss·2 likesobservability
Ademar Tutorhashnode.ademartutor.com·Feb 22, 2024Observability with OpenTelemetry, Jaeger, and RailsIn a traditional monolithic architecture, the application’s behavior is relatively straightforward because all components reside within a single process. You can easily trace requests from their entry to their exit points. However, in a microservices...DiscussRuby